Pearson correlation is a standardized measure of the linear association between two numerical variables. In exploratory data analysis, use it as a compact summary, then inspect the underlying data visually. section 6.1.3
Correlation can conceal important differences in joint structure. Anscombe’s Quartet gives four data sets with the same means and Pearson correlation of 0.816, despite visibly different relationships. Treat the coefficient as a prompt for plotting, not as a complete description. section 6.1.3
Use correlation during EDA to:
- Compare a numerical association with its scatter plot. section 6.1.3
- Check whether dispersal changes across the range before designing a modeling data set. section 6.1.3
- Avoid treating random sampling as sufficient when the relationship contains uneven coverage or deceptive covariation. section 6.1.3
Figure 6.1 Anscombe’s Quartet. Anscombe.svg: Schutz (label using subscripts): Avenue, CC BY-SA 3.0 (https://creativecommons.org/licenses/by-sa/3.0), via Wikimedia Commons
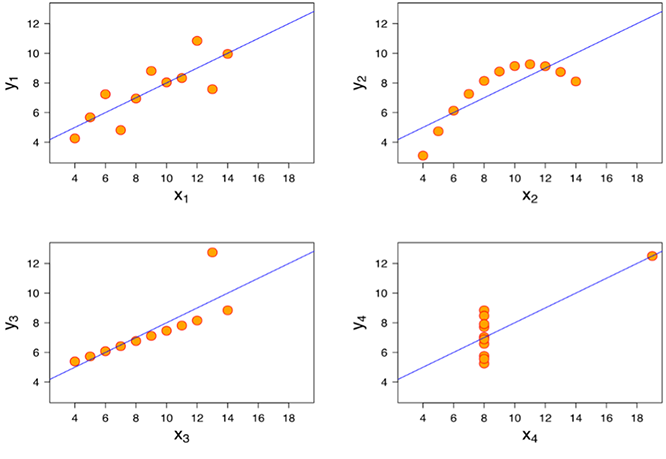
Use Anscombe’s Quartet to compare identical correlation summaries with visibly different data relationships. section 6.1.3















