A graph is structured data that represents entities as nodes and their relationships as edges. Nodes can have properties, and edges can carry labels. section 5.4.1
Graphs can represent connected data such as:
- Social networks, with people as nodes and friendships or other relationships as edges. section 1.2
- Road and subway networks, with cities or stations as nodes and routes or direct connections as edges. section 5.4.1
Subway stations
A subway graph can represent stations as nodes with name properties, and direct connections as edges labeled with the subway line. section 5.4.1
Figure 5.2 An example graph representing a small part of the subway network in New York City. Nodes, drawn as circles, represent subway stations and are associated with a property, assigning them to the name of the represented subway station. Edges, drawn as arrows, represent direct connections via specific subway lines. Edges are labeled by the subway line connecting the stations.
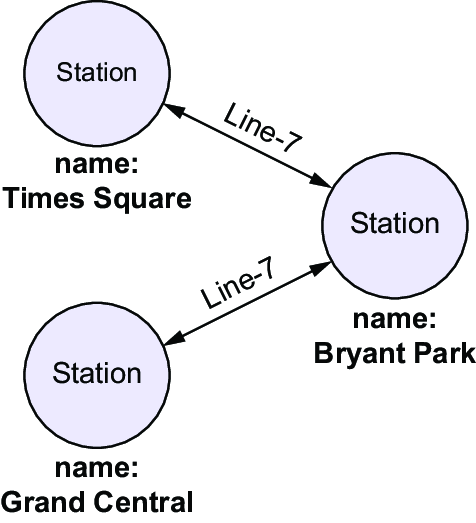
See how stations, their name properties, and line-labeled connections appear in a subway graph. section 5.4.1
Graph database systems process graph data and support graph-specific query languages. A natural-language interface can have a language model translate questions into Cypher queries, which a specialized system then runs on the data. section 5.1 section 5.4.1