A graph represents entities as nodes and their relationships as edges. Edges may be directed, showing one-way relationships, or undirected; graphs may also be acyclic or cyclic. section 5.1.1
Terraform uses directed acyclic graphs (DAGs) to model resource dependencies and plans. A dependency edge indicates which resource must be handled before another, making relationships that are not obvious from configuration visible. section 5.1.1 section 5.8
Use graph terminology to reason about Terraform behavior:
- Nodes represent resources or other entities. section 5.1.1
- Edges represent relationships; directed edges commonly express resource dependencies. section 5.1.1
- Acyclic graphs contain no circular path; circular dependencies can be difficult to locate without inspecting the graph. section 5.1.1 section 5.2.2
Visualizing a Terraform graph
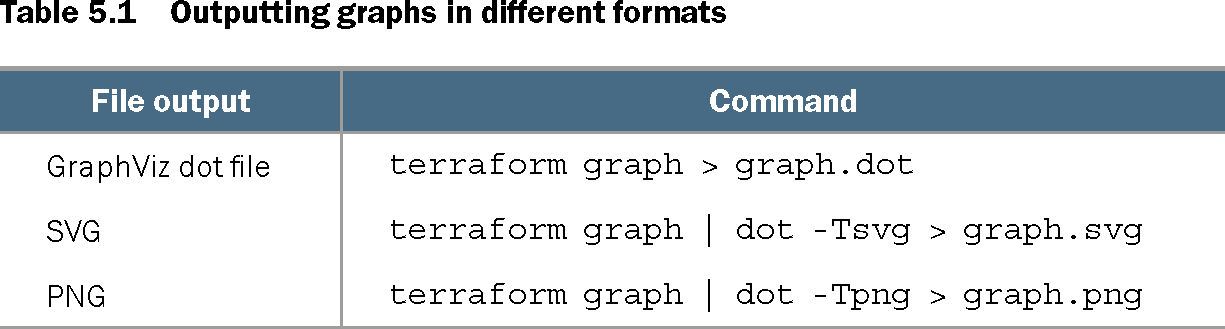
Run `terraform graph` to emit a GraphViz representation. Pipe it to `dot` to create an image, such as `terraform graph | dot -Tpng > graph.png`. The `-type` option selects plan, plan-refresh-only, plan-destroy, or apply graphs. Apply graphs require a saved plan; otherwise, a bug can produce an empty graph. section 5.2.2
Table 5.1 Outputting graphs in different formats (view table figure)
| File output |
Command |
|---|---|
| GraphViz dot file |
terraform graph > graph.dot |
| SVG |
terraform graph | dot -Tsvg > graph.svg |
| PNG |
terraform graph | dot -Tpng > graph.png |
Compare commands for producing DOT, SVG, and PNG graph output. section 5.2.2