A graph represents entities as vertices and their meaningful connections as edges. Attributes add context, allowing systems to preserve relationships instead of treating data items as independent records. section 1.1 section 9.1
Use graphs to model several recurring engineering problems:
- Represent healthcare entities such as diseases, drugs, genes, proteins, and anatomical structures with explicit relationships and properties. section 1.1
- Reduce diverse application data to a common representation for computational tasks such as node classification and relationship prediction. section 9.1
- Preserve dependencies that conventional independent-item assumptions can overlook, improving the basis for analysis and inference. section 9.1
A practical graph-processing pipeline converts source data into numerical features, maps entity identifiers to consecutive indices, constructs an edge index, and packages features, edges, and labels into a PyG Data object. Masks then separate training, validation, and testing nodes. section 12.1.3 section 12.2.2
User–movie rating graph
Encode movie genres as binary feature vectors, map user and movie IDs to consecutive values, and use each rating as a user-to-movie edge. The resulting edge_index tensor represents interactions for graph learning. section 12.2.2
Figure 1.1 Example KG in the healthcare domain. Nodes (circles) represent entities, such as people, diseases, and anatomic parts. Edges (relationships) represent meaningful connections among entities. Nodes and edges have properties describing relevant details.
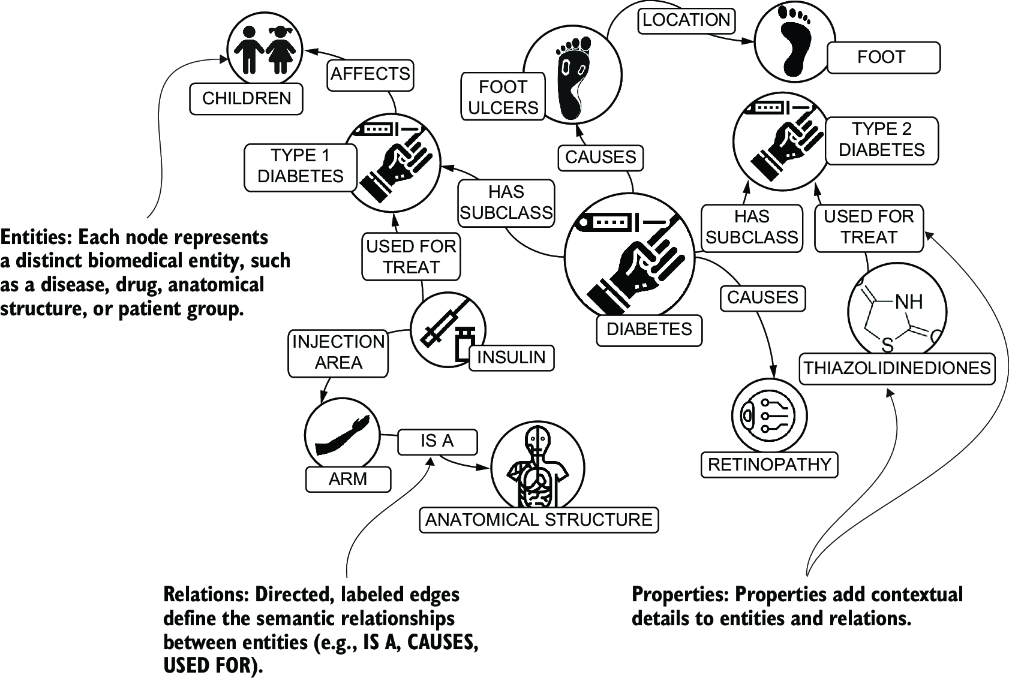
Inspect a healthcare graph showing entities as nodes, meaningful relationships as edges, and contextual details attached to both. section 1.1