A graph represents data through entities and the relationships between them. Entities are nodes (also called vertices): people, companies, cities, ideas, genes, or products. Relationships (also called edges) describe connections such as friendship, dependency, travel, or association. Unlike a table or document viewed one record at a time, a graph makes connections first-class data. section 1.0 section 1.3
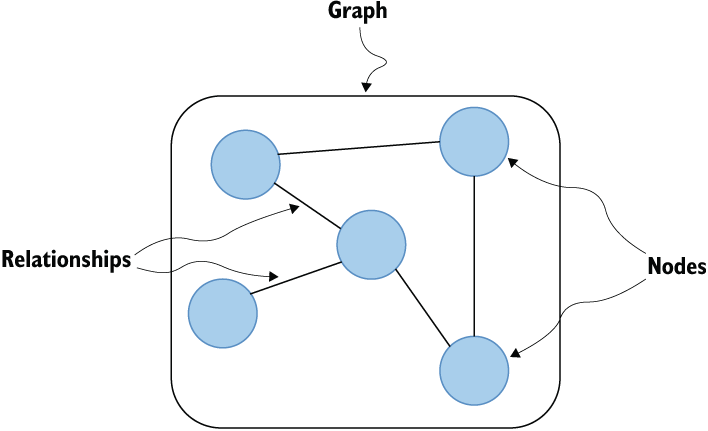
Use this small network to see the basic graph shape: circles stand for nodes, and connecting lines stand for relationships. section 1.0
Graphs are especially useful when relationships add context that aggregation alone misses. A relationship may be explicit, such as a friendship, or inferred, such as a correlation. Modeling those links can reveal patterns that remain hidden when data points are treated in isolation. section 1.0 section 1.3
Common signs that data is graph-shaped include:
- The same kind of entity connects to itself, as users follow users, services depend on services, or accounts transact with accounts. section 1.2.1
- A task must find routes through an unknown number of connections, such as transportation, logistics, payment routing, or introductions. section 1.2.2
- Many entity and relationship types combine into a dense network, as in biomedical knowledge or a customer profile assembled from several data sources. section 1.2.4
Relationship direction matters. In a directed graph, a connection has an allowed direction: one user can follow another without being followed back. In an undirected graph, the connection works both ways, as with a mutual friendship. An undirected connection can be represented with two opposite directed relationships when needed. section 2.1.1
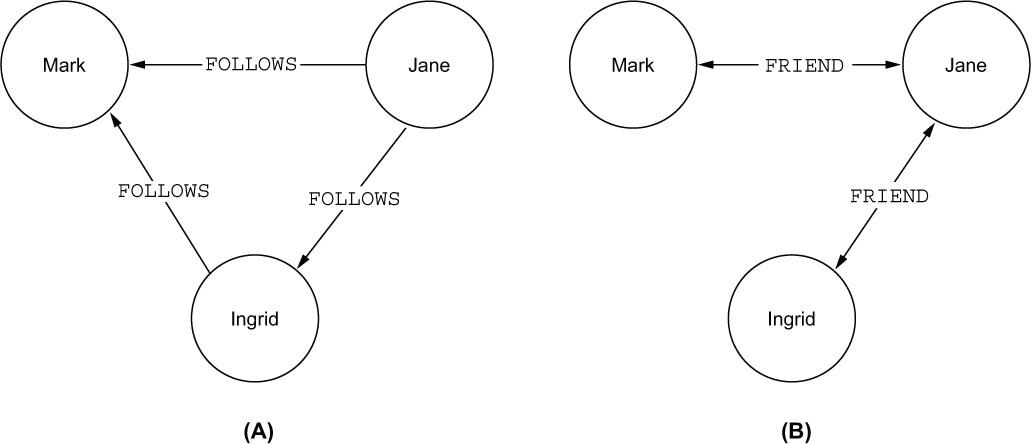
Compare one-way following with mutual friendship to decide whether a relationship’s direction is meaningful in a model. section 2.1.1
Once data is represented as a graph, its structure can support analysis. Community detection can find disconnected or tightly connected groups; centrality can identify important or influential nodes; pathfinding can locate routes under constraints such as time, distance, or cost. These outputs can also feed machine-learning workflows for link prediction or classification. section 1.2.2 section 1.3
From orders to a relationship model
An order table efficiently totals revenue, while an order document can store status and shipping details. If the analysis instead asks how customers, products, addresses, or purchases connect, represent those entities as nodes and their relevant connections as relationships. The resulting graph supports exploration of the surrounding network rather than only individual records. section 1.0