A graph represents a system as nodes connected by edges. It preserves relationships while leaving out physical details that are unnecessary for the task. In a road network, intersections can be nodes and roads can be edges; edge direction can represent the direction of travel. section 1.3.1 section 5.4.1
Figure 1.6 A directed graph model of a small subset of lower Manhattan as represented in Google Maps, with the vertices representing intersections and the edges representing roads and their directions of travel
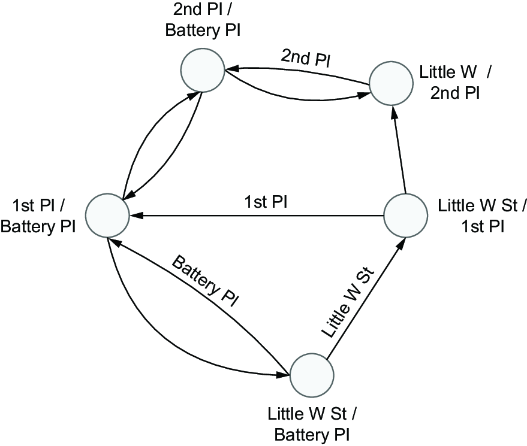
The directed road graph makes the distinction between a map’s visual surface and the connected network used for navigation concrete. section 1.3.1
That network supports turn-by-turn navigation and route optimization. It can also underpin prediction: a graph neural network can operate on the road network while combining live traffic data with historical trends to estimate future travel times. The graph supplies structure; the prediction also depends on data and a trained model. Changed traffic patterns may require retraining. section 1.3.1 section 1.3.3
A knowledge graph adds meaning to connections. An edge labeled “hasLocation” between a sensor and a room specifies a spatial relationship, not merely a link. An ontology defines the domain’s concepts, relationships, and rules, making the resulting context queryable. section 5.4.1
Seven bridges of Königsberg
Represent the land areas as nodes and the bridges between them as edges. The resulting network exposes the connection pattern without needing the city’s precise physical layout. section 5.4.1
Figure 5.6 Euler’s “Seven Bridges of Königsberg” problem, which gave rise to graph theory. He proved that it was not possible to cross each of the seven bridges connecting the two islands in the city, shown on the left, once and only once. The abstract representation of the seven bridges, two islands, and the shores on either side of the river, with nodes connected by edges, is shown on the right.
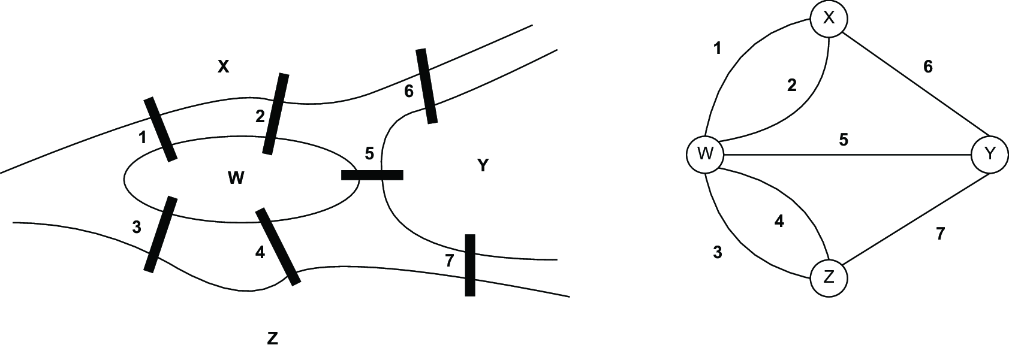
The side-by-side physical layout and abstract network show what a graph retains—and what it leaves out. section 5.4.1