A graph represents relationships as vertices connected by edges. Write G = (V, E), where V is the set of vertices and E is the set of edges. The vertices and edges depend on the task: web pages can be connected by directed links, while documents can be connected by citations. section 11.4 section 7.1.1
For N nodes, an adjacency matrix A records connectivity: Aᵢⱼ = 1 when an edge connects nodes i and j, and 0 otherwise. An undirected graph has a symmetric adjacency matrix, A = Aᵀ. If each node has F features, the node feature matrix X has shape N × F. Edges can also carry features; M edges with S features each give an M × S edge feature matrix. section 11.4
Citation network
In the CORA citation network, each node is a document and each citation is a directed edge. Adjacency entries record citations; an N × F binary feature matrix records whether each dictionary word appears in each document. A graph convolutional network uses this structure and these features to classify nodes, rather than the graph as a whole. section 11.4
The same graph can support a different computation. For page ranking, each vertex is a web page and each directed edge is a link. Link structure yields a transition matrix whose entry Aᵢⱼ is the probability of moving from page i to page j; each row sums to 1. Page rank is the stationary distribution of the resulting Markov chain. Random jumps, including a fallback for pages without outgoing links, make states reachable and permit the power method to compute ranks iteratively. section 2.1.2 section 7.1.1
Figure 2.3 A graph of web pages with transition probabilities
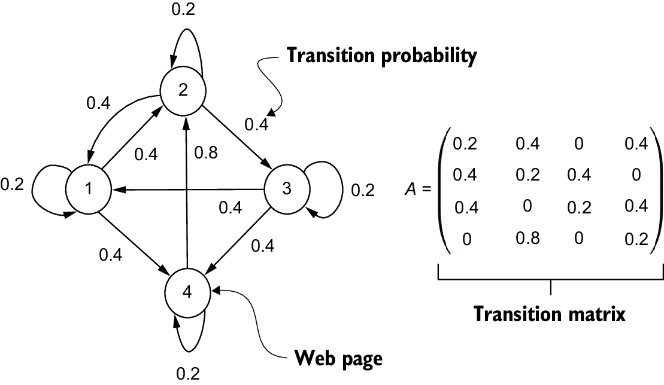
A web-page graph annotated with transition probabilities connects directed links to the matrix used for page ranking. section 2.1.2