Linear regression predicts a continuous value from labeled examples. Given people’s heights and weights, it can fit a relationship that takes height as input and predicts weight. Height is the independent variable; weight is the target. section 1.5.1
A simple model writes the prediction as Weight = β0 × height + β1. One coefficient scales height; the other adds a constant. With multiple inputs, the relationship can be written Y = β0 + β1x1 + β2x2 + … + ε. The displayed formulas use different coefficient numbering, so read each coefficient by its position in the equation. section 1.5.1
Figure 1.12 Raw data that needs to be modeled (left). Using regression, a line of best fit is identified (right).
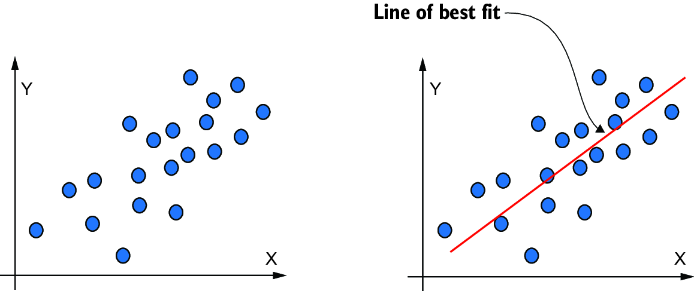
Compare the raw observations with the fitted line: the line summarizes a relationship that can be used to predict a continuous target. section 1.5.1
Choose regression for quantities such as revenue or rainfall, not for categorical answers such as whether a transaction is fraudulent. Linear regression can produce values below 0 or above 1, so its output is not suitable as a classification probability. section 1.5.1 section 1.7





















