Linear regression fits coefficients that make a response estimate a linear combination of chosen features. In response-surface optimization, the features can include nonlinear transforms: a profit-versus-threshold parabola uses an intercept, threshold, and threshold squared. The fitted curve is a surrogate function: an estimate of the underlying response surface from aggregate experimental measurements. section 4.1.3
For measurements y and design matrix X, the fit computes a coefficient vector β with the normal equations. Predictions are then Xβ; approximation error ε is the difference between a measured value and its prediction. With three measurements and three parabola parameters, the example fits exactly, but the usual case has nonzero approximation error. section 4.1.3
Optimizing a trading threshold
Build X with columns of ones, threshold x, and x²; calculate β as inv(XᵀX)Xᵀy; then evaluate the fitted parabola on a fine grid of threshold values. Select the grid point with maximum predicted markout profit. This is much faster than experimentally measuring hundreds of thresholds, but the selected threshold remains an estimate and needs a production measurement for validation. section 4.1.3 section 4.1.4
Figure 4.10 A surrogate function, an interpolation (dashed line) between measurements (dots) of profit. The curve, a parabola, estimated using linear regression, estimates the true response surface.
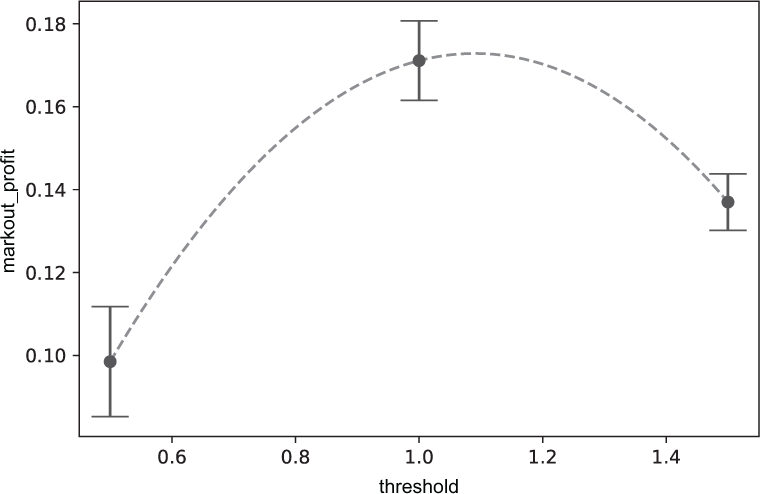
The curve and measurement dots distinguish interpolation estimates from observed profit values, making the surrogate role concrete. section 4.1.3
With two controllable parameters, linear regression still operates on a feature matrix, but the quadratic surrogate expands to an intercept, one linear term per parameter, squared terms, and a cross term. The cross term models behavior between diagonal settings of the experiment design. Interpolating the fitted surface over a grid supports a search for the estimated best threshold and order size. section 4.2.2
Practical safeguards follow from how the fit is used:
- Treat an optimized setting as an educated guess from a model, not proof of production performance; measure it experimentally to validate the estimate. section 4.1.4
- Revisit the experiment design when an outlying measurement indicates the model is not being fit near an optimum. section 4.2.2
- Use a pseudoinverse when fitting per-action models from logs, rather than the direct inverse used in the smaller response-surface implementation. section 5.1.1
Per-action reward models
A recommender can fit one regression per available post. For each action, collect logged user context vectors as X and viewing-time rewards as y, then calculate a β vector. The resulting models predict reward from context; bootstrap-resampling the logged data and refitting produces several similar but varying models for Thompson-sampling exploration. section 5.1.1 section 5.3.1





















