A mean is an average value. For a random variable, the expected value is its probability-weighted average; for a Gaussian vector, the mean vector lists each variable’s expected value. section 2.2.1
Use the mean in several related ways:
- Summarize a distribution with its central expected value. section 2.2.1
- Represent a Gaussian process’s predictive mean, which smoothly interpolates training data after fitting. section 2.6
- Combine the predictive mean with uncertainty in an upper-confidence-bound score, μ + βσ. section 5.2.2
Mean in Bayesian optimization
An upper-confidence-bound policy scores a candidate as μ + βσ. Setting β = 0 uses only the mean and favors exploitation; increasing β gives uncertainty more influence and encourages exploration. section 5.2.2
Figure 2.4 An MVN distribution groups multiple normally distributed random variables together. While the mean vector of the MVN concatenates the mean values, the covariance matrix models the correlations between the individual variables.
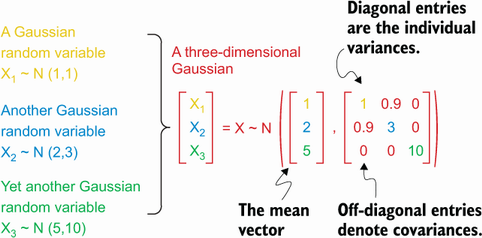
Visualizes how a multivariate Gaussian stores expected values in a mean vector while using covariance to describe variation and relationships. section 2.2.1