A mean is a measure of central tendency calculated as the arithmetic average of numerical observations. For detector ensembles, it combines the scores produced by multiple detectors into one final score, balancing evidence across them. section 14.6 section 14.6.1
Averaging usually gives less influence to one exceptionally high detector score than taking the maximum. It can therefore be safer, but it also averages in detectors that regard a record as normal and can overweight correlated detectors. section 14.6.1
Interpret a mean score with these cautions:
- Use a threshold on the final score to balance false positives against false negatives; changing the threshold can alter the decision without changing the aggregation method. section 14.6
- Treat correlated detectors carefully, because their related scores can effectively give one detection approach more weight. section 14.6.1
- Prefer maximum rather than mean when different feature subspaces are tested and only some subspaces are expected to expose an outlier. section 14.6.1
Four-detector scores
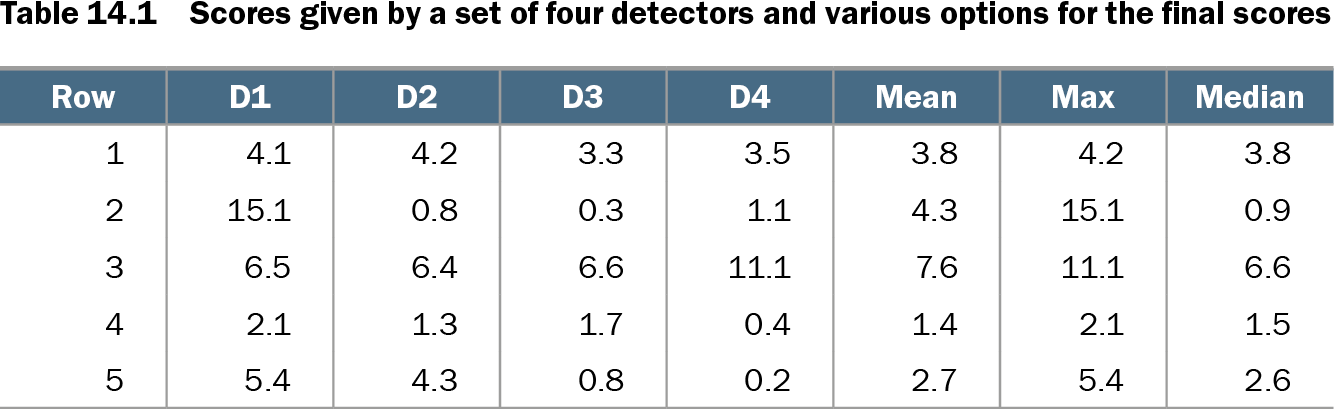
For row 3, scores of 6.5, 6.4, 6.6, and 11.1 produce a mean of 7.6. Row 2 has one extreme score, 15.1, and three low scores, producing a mean of 4.3 but a maximum of 15.1. The mean therefore favors consistently elevated evidence, while the maximum emphasizes a single detector. section 14.6.1
Table 14.1 Scores given by a set of four detectors and various options for the final scores (view table figure)
| Row |
D1 |
D2 |
D3 |
D4 |
Mean |
Max |
Median |
|---|---|---|---|---|---|---|---|
| 1 |
4.1 |
4.2 |
3.3 |
3.5 |
3.8 |
4.2 |
3.8 |
| 2 |
15.1 |
0.8 |
0.3 |
1.1 |
4.3 |
15.1 |
0.9 |
| 3 |
6.5 |
6.4 |
6.6 |
11.1 |
7.6 |
11.1 |
6.6 |
| 4 |
2.1 |
1.3 |
1.7 |
0.4 |
1.4 |
2.1 |
1.5 |
| 5 |
5.4 |
4.3 |
0.8 |
0.2 |
2.7 |
5.4 |
2.6 |
Compare mean, maximum, and median final scores across five records and four detectors. section 14.6.1