The mean is the arithmetic average: add the numerical values and divide by the number of values. It gives a single measure of central tendency, useful for summarizing a dataset or comparing groups. But an average is not a complete picture of the data. section 4.1.1
Comparing daily temperatures
A bar graph of mean daily high temperatures makes New York City look slightly warmer than Boston over a month. The averages do not show day-to-day fluctuations, the full range of temperatures, or whether the difference is meaningful. Inspect the underlying values and use further comparisons before drawing that conclusion. section 4.1
Choose and report a mean with the distribution in mind:
- For a roughly symmetrical distribution with a meaningful center, either the mean or median can describe a typical value. section 4.1.2
- For skewed or asymmetrical data, consider the median instead: extreme values can shift the mean substantially while leaving the median unchanged. section 4.1.1 section 4.1.2
- Pair a central value with measures of spread or a distribution plot. Distinct distributions can share a mean, and a mean alone can hide their differences. section 4.1.1 section 4.1.2
Figure 4.6 Three distinct distributions with an identical mean of 10. The interpretation of the mean or “average” is very different for each distribution.
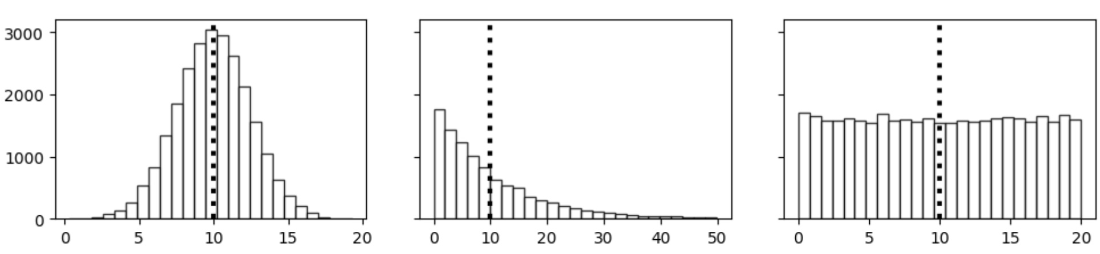
These three distributions have the same mean of 10. Compare their shapes before treating 10 as a typical value for each. section 4.1.1
The mean also anchors related measures: standard deviation describes deviation from it, while standard error addresses how close a sample mean may be to the population mean. Check and report appropriate descriptive statistics before running statistical tests, and make clear to stakeholders what the chosen average does—and does not—represent. section 4.1.2