Overfitting happens when a model becomes so complex that it fits the training data extremely closely without capturing the underlying pattern. It can look successful during training yet make poor predictions on new data. Think of memorizing a textbook word for word instead of learning how to answer unfamiliar exam questions. section 4.0 section 4.15
A curve that follows every dot
For data that roughly forms a downward-opening parabola, a line is too simple and underfits. A degree-2 polynomial captures the main shape. A degree-10 polynomial can pass through every noisy training point, but its unnecessary twists show that it is fitting details rather than the data’s essential pattern. section 4.1
A useful warning sign is a gap between training and validation results: an overfit model performs well on the training set but poorly on the validation set. Keep testing data separate: it is for final evaluation, not training or choosing model settings. Use a validation set to compare hyperparameters and model complexity. section 4.15
Figure 4.5 The model complexity graph is an effective tool to help us determine the ideal complexity of a model to avoid underfitting and overfitting. In this model complexity graph, the horizontal axis represents the degree of several polynomial regression models, from 0 to 10 (i.e., the complexity of the model). The vertical axis represents the error, which in this case is given by the mean absolute error. Notice that the training error starts large and decreases as we move to the right. This is because the more complex our model is, the better it can fit the training data. The validation error, however, starts large, then decreases, and then increases again—very simple models can’t fit our data well (they underfit), whereas very complex models fit our training data but not our validation data because they overfit. A happy point in the middle is where our model neither underfits or overfits, and we can find it using the model complexity graph.
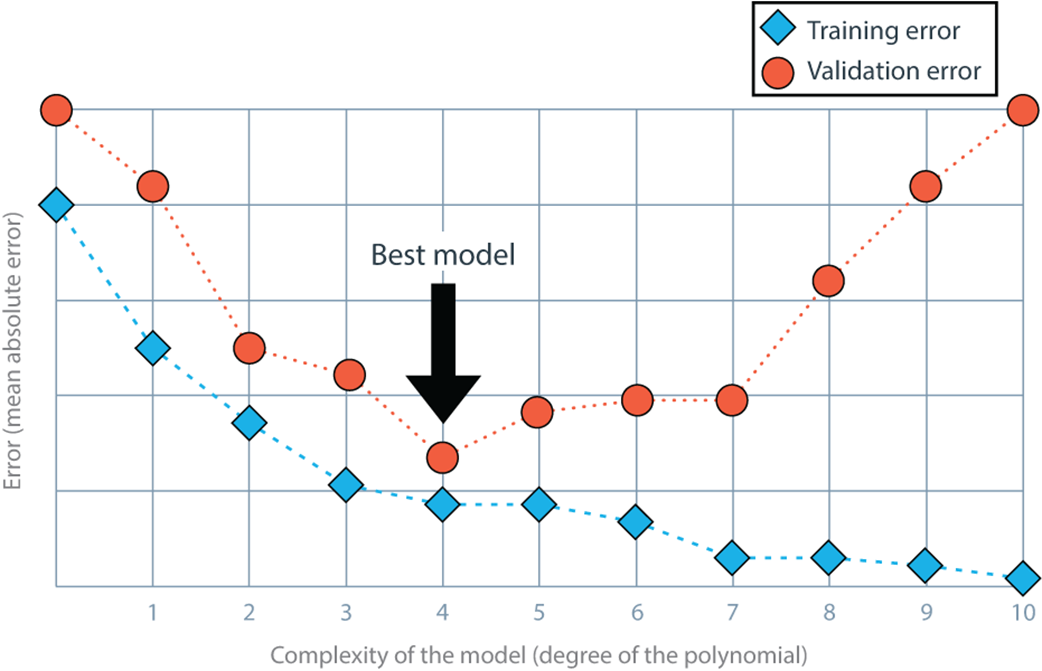
Compare the two error curves as model complexity rises. Training error usually keeps falling, while validation error eventually rises; that rising validation error signals overfitting. Choose a useful middle point, while considering whether a simpler near-equal model better fits practical constraints. section 4.6
Common ways to reduce overfitting include:
- Choose a model complexity supported by validation performance rather than training error alone. section 4.6
- Add regularization, which includes a complexity measure in the error function during training. section 4.15
- Use L1 regularization when many features should become zero, or L2 regularization when features should become smaller without becoming zero. section 4.15
Movie recommendations
A recommendation model with a few meaningful movie weights can be easier to interpret than one with large weights for every movie. The complicated model may achieve lower training error by memorizing the data, so regularization is used to discourage that excess complexity. section 4.8
Overfitting is not limited to polynomial regression. A decision tree trained on student-admissions data scored 100% on its training set and reached depth 10, both clues that it had massively overfit. Tree hyperparameters can help limit this behavior. section 9.12