An execution tracer records Go runtime events and makes them available for visualization. Use it to investigate performance and understand what happens while an application runs. section 12.8.2
A trace can help diagnose:
- Garbage-collection activity. section 12.8.2
- How goroutines execute and whether work is poorly parallelized. section 12.8.2
Spotting poor parallelization
Tracing a parallel merge-sort benchmark reveals many short goroutine executions and gaps spent orchestrating goroutines rather than running application code. Comparing it with a faster implementation shows longer executions and fewer gaps. section 12.8.2
$ go test -bench=. -v -trace=trace.out
Run a benchmark with tracing enabled to create a trace file for inspection. section 12.8.2
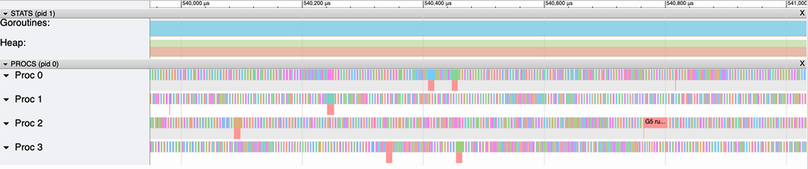
Many short bars in the timeline indicate poorly parallelized execution. section 12.8.2