liveBook · Manning

Trajectory

As explained in gRPC Microservices in Go

Tracing records and correlates the path and timing of requests as they propagate through distributed components.

A trace records a request’s journey across distributed services. It groups the operations handling one transaction and carries request metadata until the request reaches its final service. section 9.1.1

A trace ID lets teams group request flows and investigate latency across downstream services. A trace can contain multiple spans, each representing an operation; spans can expose service, method, and client-or-server metadata. section 1.4.4 section 9.1.1

PlaceOrder trace

A PlaceOrder request can produce spans for saving to a database and calling the Payment service. Inspecting the trace ID and spans helps follow the request across those operations. section 9.1.1
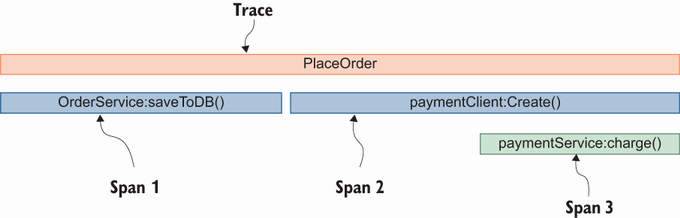
Figure 9.1 Journey of a request

View the request journey as it crosses services and operations. section 9.1.1

How gRPC Microservices in Go covers it

How deep it goes
Defines traces and spans and explains gRPC span metadata, without detailing instrumentation setup.
Examples
Shows a PlaceOrder trace with database and Payment operations, plus gRPC span metadata.
What you can do after
Diagnose request latency by grouping operations with trace IDs and inspecting service-to-service flows.
How it connects
Connects traces with spans, metrics, logs, OpenTelemetry, and gRPC.

Also explained in

Compare how 19 books explain trajectory →

Related concepts

This explainer was generated by Manning's knowledge graph from the text of gRPC Microservices in Go. The section links point to the parts of the book it draws on.