liveBook · Manning

Trajectory

As explained in Platform Engineering on Kubernetes

Tracing is the practice of recording and correlating the operations performed during a request across services and infrastructure.

Tracing records and correlates operations during a request across services and infrastructure. It helps teams understand service behavior and performance, and find problems in distributed applications. section 2.4 section 2.4.5

Services need instrumentation to expose their internal operations and performance. OpenTelemetry provides instrumentation libraries and a collector architecture for receiving telemetry from applications. section 2.4.5
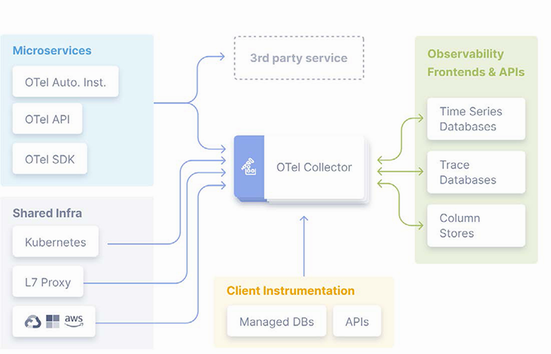
Figure 2.30 OpenTelemetry architecture and library (Source: https://opentelemetry.io/docs/)

The architecture diagram shows OpenTelemetry libraries and collector components. section 2.4.5

How Platform Engineering on Kubernetes covers it

How deep it goes
Explains service instrumentation and the OpenTelemetry collector architecture without detailing implementation steps.
Examples
Uses instrumented services sending telemetry to an OpenTelemetry collector as its architecture example.
What you can do after
Understand which services call other services or infrastructure and assess their performance.
How it connects
Connects tracing with OpenTelemetry, telemetry, metrics, logs, and service-level agreements.

Also explained in

Compare how 19 books explain trajectory →

Related concepts

This explainer was generated by Manning's knowledge graph from the text of Platform Engineering on Kubernetes. The section links point to the parts of the book it draws on.