A request trajectory, or trace, records where one request goes and how long each operation takes. It helps diagnose failures and performance bottlenecks when a client request passes through several components or services. Unlike a health check or an aggregate metric, a trace follows one request’s path. section 10.4 section 10.0
Each incoming request has a trace ID. Its trace contains spans: individual units of work with their own IDs, typically arranged as a tree. A span may represent a method call, database operation, or remote request. Propagating the trace ID between services lets their spans be correlated, provided those services support tracing and the protocol can carry the metadata. section 10.4
A REST request and its database work
A request to add a product produces a root span for the REST call and two child spans: a SELECT that obtains the next ID and an INSERT that saves the product. The span tree makes the operations belonging to that request visible together. section 10.4
For a Quarkus service, add the OpenTelemetry extension with `quarkus extension add opentelemetry`. Adding it to each participating service enables tracing without changing the application code in the car-rental example. OpenTelemetry exports the data using OTLP; Jaeger can receive it directly and provide a UI for viewing traces. The example exposes Jaeger’s UI on port 16686 and its OTLP receiver on port 4317, the extension’s default local export target. An OpenTelemetry Collector is optional here, but can centrally handle filtering, batching, and retries in larger deployments. section 10.4.2 section 10.4.1
Figure 10.15 Jaeger UI—graph of spans from calling the car availability endpoint
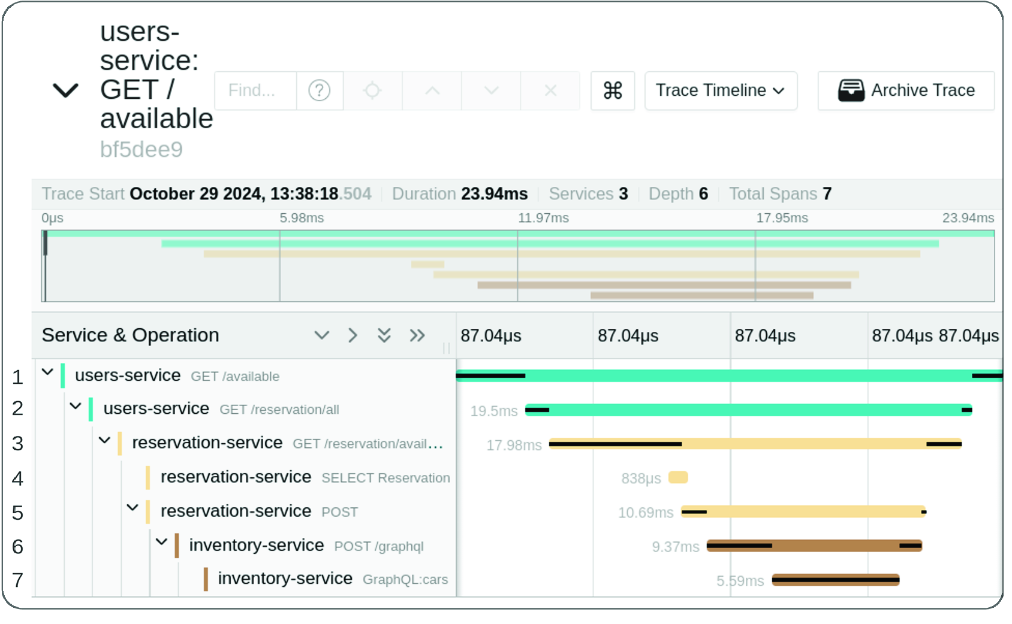
The span graph makes the operations triggered by a car-availability request easier to inspect as one trace. section 10.4.2