liveBook · Manning

Correlation

As explained in Claude at Work

Correlation is a statistical association describing how two variables vary together.

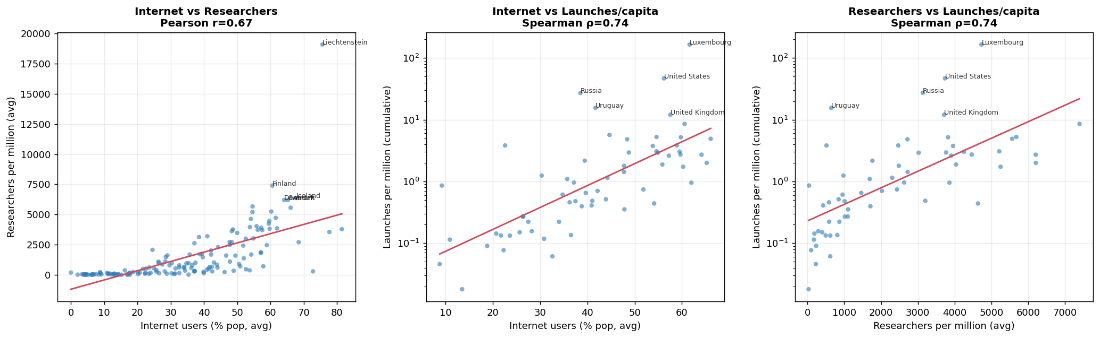
Use correlation as an exploratory question: do internet use, R&D researchers, and space launches vary together? Ask Claude to investigate downloaded data and build a report using rigorous scientific methods; keep prompts limited so it can explore. section 3.3

Example Our World in Data datasets to compare:

Figure 3.4 Charts Claude generated using pandas from the Our World in Data ZIP files in my folder
CH03 F04 Stoneman

Generated charts offer a visual view of the dataset exploration. section 3.3
How Claude at Work covers it

How deep it goes
Frames a data exploration around rigorous methods but gives no calculation or interpretation of correlation.
Examples
Compares internet use, R&D researchers per million people, and annual space launches.
What it assumes
Assumes access to downloaded ZIP datasets in a local folder and teaches the exploration workflow from opening them.
What you can do after
Evaluate possible associations by asking Claude to explore downloaded datasets and produce a research report.
How it connects
Links correlation questions to trend analysis, structured data, and charts.

Also explained in

Compare how 22 books explain correlation →

Related concepts

This explainer was generated by Manning's knowledge graph from the text of Claude at Work. The section links point to the parts of the book it draws on.