Data visualization represents data graphically so stakeholders can interpret patterns, comparisons, and relationships. Analysts commonly deliver visualizations in reports, presentations, dashboards, and other analytical outputs. section 1.2.4
Choose the form and tool according to the analytical task and stakeholder workflow:
- Static visualizations use charts, graphs, and other visuals in reports or presentations. Spreadsheets, R, and Python can generate them. section 1.2.4
- Dynamic visualizations and dashboards let stakeholders revisit analyses, explore subsets, and answer predictable questions as new data arrives. section 1.2.4
- Tableau and Power BI provide drag-and-drop creation, connections to multiple data sources, and presentation-ready interactive dashboards without requiring programming. section 12.2.1
- Dashboard tools do not replace analysts: they can be weak for long-form exploratory analysis, slow dataset refreshes, and collaboration. section 12.2.1
Figure 12.4 An interactive data-powered app predicting rat sightings, created using Streamlit.
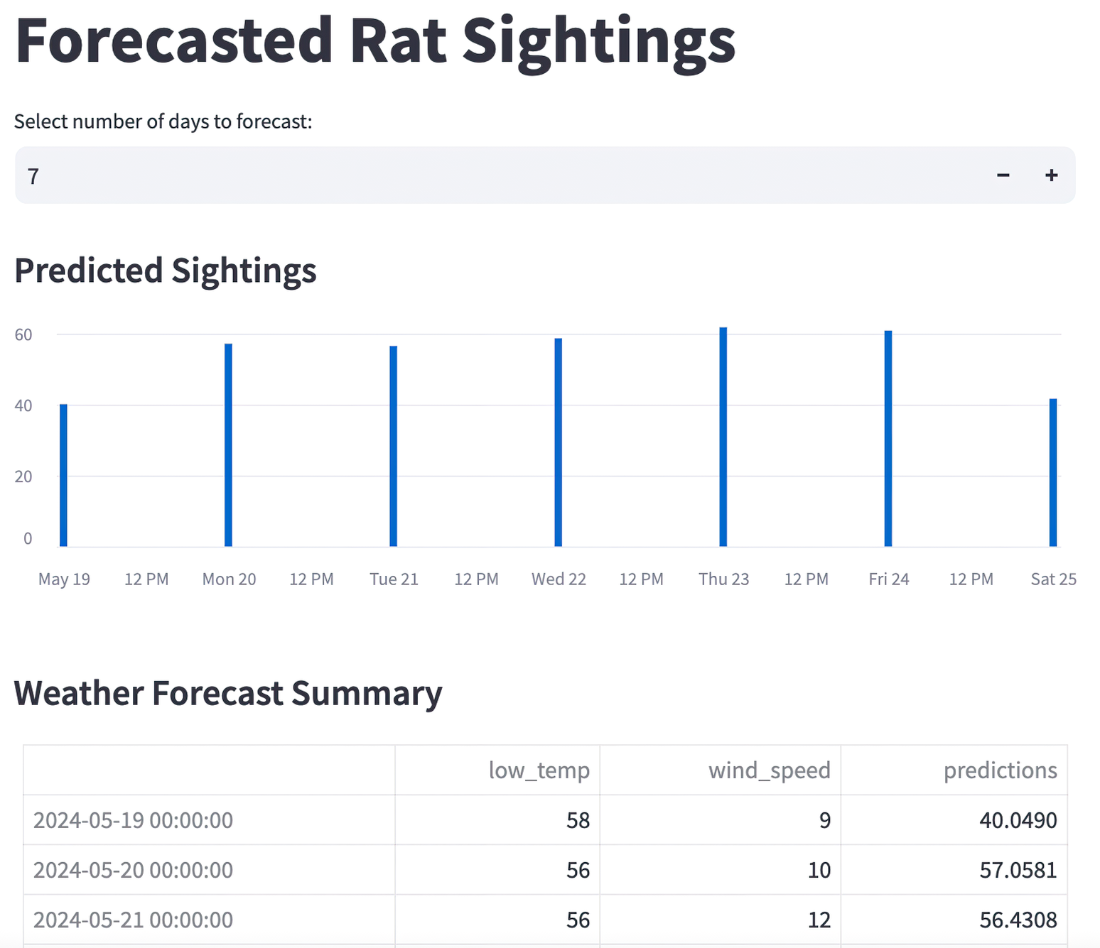
An interactive data-powered app illustrates how visualization can extend beyond reports into reusable stakeholder-facing analytical tools. section 12.2.1