Visualization represents data as a visual map to reveal overall characteristics, patterns, relationships, dispersion, and anomalies during exploratory data analysis. section 6.1.1 section 6.1.3
Use visualizations to:
- Check whether training data represents the target domain and whether its variance supports appropriate validation and training order. section 6.1.1
- Expand summary statistics into visible distributions and relationships; scatter and ridgeline plots can expose patterns that aggregate values conceal. section 6.1.3
- Inspect unstructured data through model-based reductions when raw images or text cannot be directly interpreted. section 6.1.1
Expose misleading summaries
Anscombe’s Quartet shows four datasets with identical means and Pearson correlations but visibly different joint structures. A tips-versus-bills plot similarly reveals uneven dispersion, warning against random sampling that misses important regions of the data. section 6.1.3
Figure 6.1 Anscombe’s Quartet. Anscombe.svg: Schutz (label using subscripts): Avenue, CC BY-SA 3.0 (https://creativecommons.org/licenses/by-sa/3.0), via Wikimedia Commons
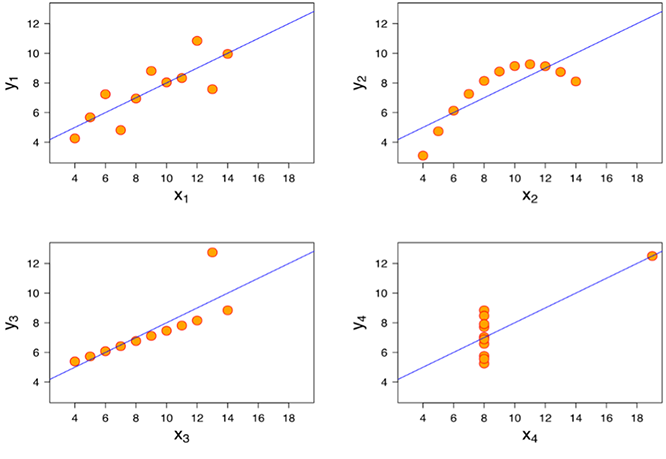
Compare the four plotted datasets to see why identical summary statistics do not guarantee identical data structure. section 6.1.3