Visualization represents data visually to reveal distributions, relationships, and unusual observations. For outlier detection, it is flexible and useful as an exploratory first step, but less precise and more subjective than statistical methods. section 2.1.5 section 2.3.2
Choose plots according to the feature types and dimensionality:
- Plot numeric features with histograms and categorical features with bar or count plots. section 2.3.2 section 8.1.2
- Use scatterplots for two numeric features, heatmaps for two categorical features, and boxplots for one categorical and one numeric feature. section 2.3.2
- Inspect log-scaled views when distributions are strongly skewed or plausibly log-normal. section 2.1.5
- Treat plots as a smoke test and debugging aid, not as the sole evaluation method for multidimensional detectors. section 8.3 section 8.8
Flagged values in one-dimensional plots
Plot a histogram of feature A and draw vertical lines for rows marked as outliers. This can clarify extreme one-dimensional values, but multivariate outliers may look ordinary in every individual histogram. section 8.1.2
Comparing detector results in a feature pair
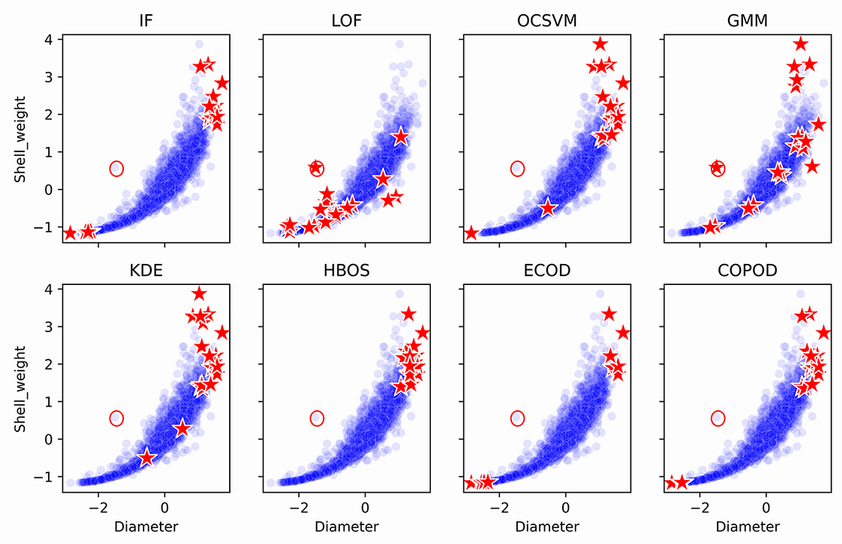
Plot Diameter against Shell_weight in the abalone data and compare the top-ranked points from several detectors. A point outside the main cluster may be flagged by LOF and GMM but not by others, while points inside the cluster may be anomalous in another feature space. section 8.3.1
Figure 8.7 2D plots of two features, Diameter and Shell_weight from the abalone dataset, tested with eight detectors. There are some points that appear to be the strongest outliers, including a point outside the main cluster (circled), which is flagged only by LOF and GMM. In addition, the largest point in the Shell_weight dimension, at the top of the plot, which is flagged only by OCSVM, GMM, and KDE. Some detectors, including LOF, GMM, and KDE, flag points within the main cluster, which may be legitimate as they may be outliers in other spaces.
Compare detector flags against visible structure in a two-dimensional feature space. section 8.3.1