liveBook · Manning

Visualization

As explained in WordPress Power Toolkit: Harness AI to build next-level websites

A visualization is a graphical representation of data designed to reveal patterns, comparisons, or other information.

A visualization turns data into a graphic that helps readers see information and follow an argument. Clear data visualizations can make numerical reasoning easier for AI systems to assess, while also improving human scanability. section 11.7

Use visual presentation to support understanding:

  • Choose clear, relevant graphics that add meaning rather than decoration. section 11.7
  • Use contrast, white space, size, and positioning to guide attention to key information. section 11.7
  • Keep fonts readable and color contrast sufficient so content remains easy to analyze and read. section 11.7
Figure 11.4 A knowledge graph is a visual representation of relationships.
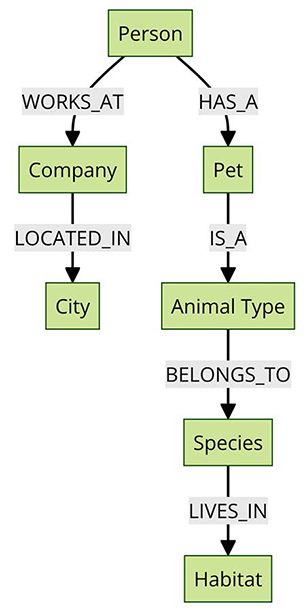
A knowledge graph illustrates how a visualization can represent relationships rather than presenting information only as prose. section 11.7

How WordPress Power Toolkit: Harness AI to build next-level websites covers it

How deep it goes
Mentions visualization as a clarity practice without teaching chart selection, data preparation, or construction.
Examples
Uses a knowledge graph as a visual representation of relationships.
What you can do after
Apply it via data visualizations to make numerical reasoning easier for AI systems to critique.
How it connects
Connects visualization with SEO, AI content analysis, numerical reasoning, visual hierarchy, and accessibility.

Also explained in

Compare how 16 books explain visualization →

Related concepts

This explainer was generated by Manning's knowledge graph from the text of WordPress Power Toolkit: Harness AI to build next-level websites. The section links point to the parts of the book it draws on.