A trace records the journey of one request across a system. It brings otherwise isolated service signals together so an operator can see which work ran, how long it took, and where it failed. A trace can carry the request input and output, total duration and cost, and metadata such as workflow and user identifiers. section 7.0 section 7.2.1
A trace is a tree of spans. The root represents the request; child spans represent service operations and can contain further work. Each span records timing, status, and service-specific attributes. A waterfall view makes the nesting and duration visible, helping identify the operation responsible for a slow response. section 7.2.1 section 7.4.3
Figure 7.4 The observability data model hierarchy. Sessions group related traces (a multi-turn conversation). Each trace represents a single user request flowing through the platform. Traces contain spans (units of work in a service) which can nest. Generations are a specialized span type for LLM calls, carrying model-specific attributes like token counts and cost. Scores can attach to any level traces, spans, or generations and come from automated heuristics, LLM judges, or human reviewers.
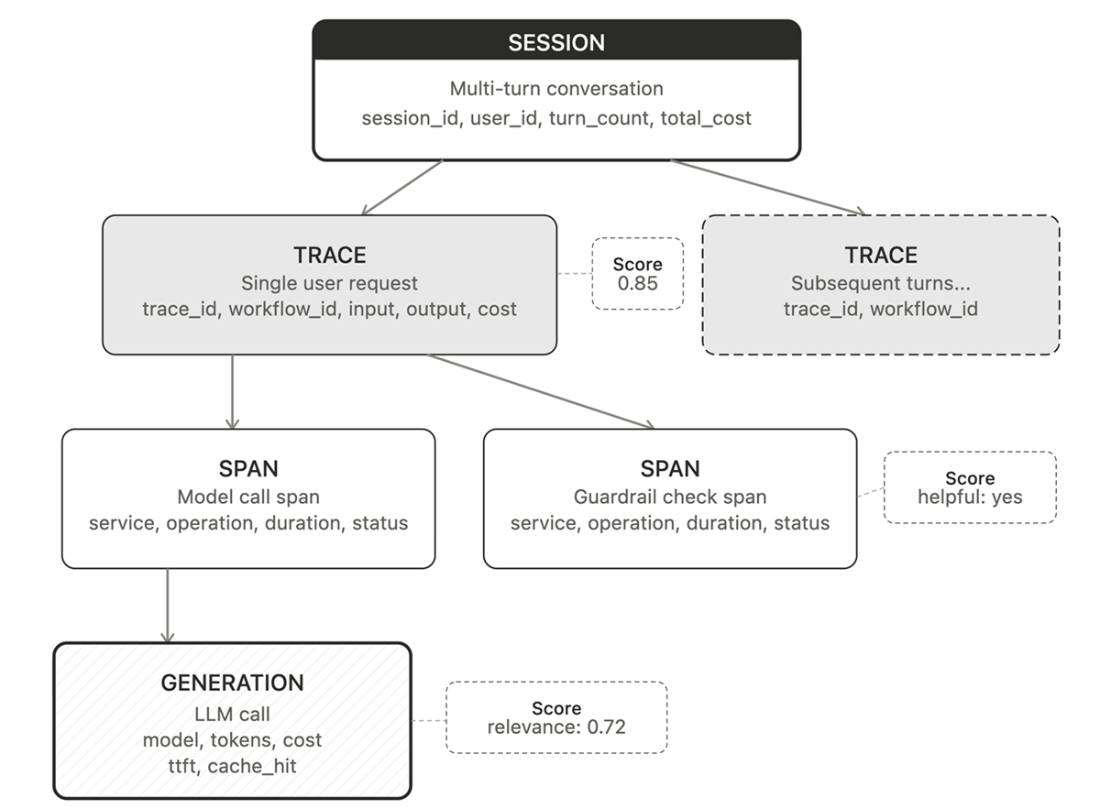
The hierarchy places a single-request trace between a conversation session and its nested spans, generations, and scores. section 7.2.1
A session groups related request traces. A generation specializes a span for a model call, adding indexed fields such as model, token counts, cost, cache status, and time to first token. Quality scores can attach to traces, spans, or generations; they may arrive after the request completes. section 7.2.1 section 7.3.1 section 7.4.3
The gateway seeds a trace ID, and downstream services propagate context and record their own spans against it. Parent span IDs preserve the tree. The observability service assembles the trace afterward: no single service has the complete picture, so the contract records spans and generations rather than a complete trace. GetTrace retrieves an assembled trace; QueryTraces searches across traces. section 7.3.1 section 7.4.3
Diagnosing a slow assistant request
A patient intake request can produce spans for session history, document retrieval, guardrail checks, model generation, and storing the exchange. The shared trace ID ties the operations together; the generation records model-specific usage and cost. To investigate latency, start with the waterfall, inspect the bottleneck service's logs using the trace ID, then check metrics to see whether the problem is an outlier or a pattern. section 7.2.2 section 7.4.3
Automatic tracing covers standard platform service calls, but application-specific work can otherwise appear as a gap. Instrument custom steps with the SDK's trace operation context manager so their spans inherit the trace ID and nest alongside platform-generated spans. section 7.5.4
Listing 7.10 Adding a custom span for application-specific logic
with platform.observability.trace_operation(
    "custom_rerank", trace_context,    #A
    num_candidates=len(candidates),
    rerank_model="cross-encoder",
) as rerank_ctx:
    reranked = my_reranker.rerank(candidates, query)
A custom reranking span records application-specific work inside the existing trace context. section 7.5.4