A threshold is a cutoff that turns a score or value into a decision. On one side belongs one outcome; on the other side belongs another. For a sentiment classifier, word weights are added to score a sentence: a score of 3.5 or more means happy, while a lower score means sad. section 5.4
The same rule can be written with a bias instead of a threshold. A threshold of 3.5 is equivalent to adding a bias of −3.5 and predicting happy when the final score is zero or greater. This moves the decision line without changing which inputs fall in each region. section 5.5
Thresholds appear in several kinds of models:
- For probability predictions, choose a value such as 0.5: predictions at or above it are positive, and the rest are negative. The value can be changed from 0 to 1. section 7.14
- For classification trees, select a feature value that best divides labeled points, such as x0 = 5, then repeat on the resulting groups. section 9.10
- For regression trees, test numerical cutoffs, predict each side by its average label, and select the cutoff with the smallest mean square error. section 9.14
Trading sensitivity for specificity
Imagine a model that estimates whether someone should receive more medical tests. A low threshold marks even mild symptoms as positive: sensitivity rises, but specificity falls. A high threshold requires stronger evidence: specificity rises, but sensitivity falls. An ROC curve helps compare these choices for the goal at hand. section 7.16
Figure 7.3 The effects of moving the threshold on the sensitivity and the specificity. On the left, we have a model with a low threshold; in the middle, we have one with a medium threshold; and on the right, we have one with a high threshold. For each of the models, there are five positive and five negative points. Each model is represented by the vertical line. The model predicts that the points to the right of the line are positive and those to the left are negative. For each of the models, we’ve counted the number of true positives and true negatives, that is, the number of positive and negative points that have been correctly predicted. We have used those to calculate the sensitivity and the specificity. Note that as we increase the threshold (i.e., as we move the vertical line from left to right), the sensitivity goes down and the specificity goes up.
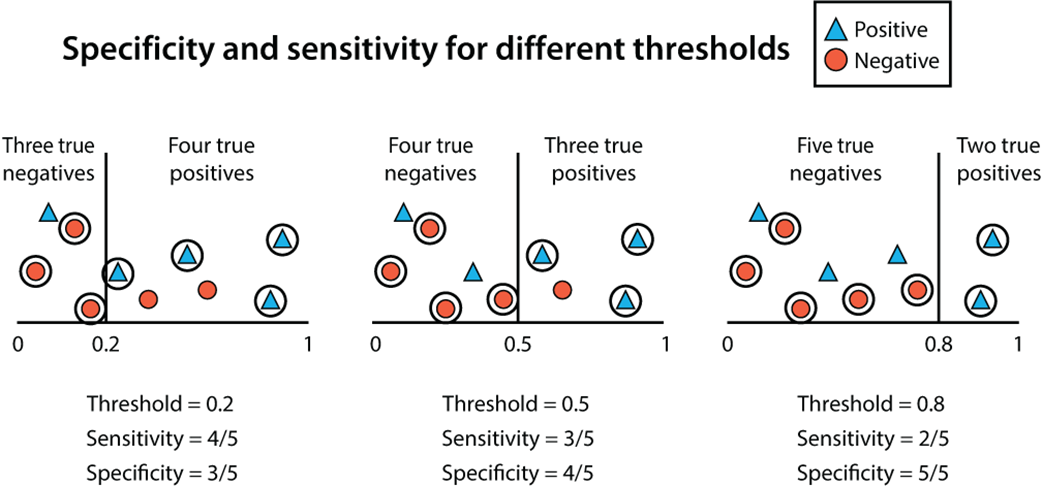
Compare low, medium, and high probability thresholds visually to see why moving the boundary changes true positives, true negatives, sensitivity, and specificity. section 7.14
Splitting app-engagement predictions
With ages and weekly app-engagement labels, a regression tree can test age cutoffs such as 15, 25, 35, and 65. The cutoff at 35 has the smallest MSE in the example, so it becomes the first split; later splits create smaller groups with their own average predictions. section 9.14