A classification threshold converts a model’s score into a class decision. A default cutoff of 0.5 can miss a high-risk case: a medicine scored 0.21 and was classified LOW RISK despite being a high-risk example. The score and the decision are different outputs; the cutoff determines how the score is used. section 4.6.4
Listing 4.10 Classification output
========== FINAL MODEL DEMO ==========
--- LOW RISK EXAMPLE ---
Risk Probability: 0.07
Predicted Risk Level: LOW RISK ✅
--- HIGH RISK EXAMPLE ---
Risk Probability: 0.21
Predicted Risk Level: LOW RISK ✅
The two predictions show how a 0.5 cutoff produces a low-risk decision for both examples. section 4.6.4
Lowering the threshold marks more cases as high risk, potentially catching more actual risks but also increasing false positives. Raising it shifts more predictions to low risk and may miss real risks. For example, 0.31 is high risk at a 0.3 cutoff, while 0.55 is low risk at a 0.6 cutoff. section 4.6.5
Choose a cutoff against the consequences of missed risks and false alarms, rather than treating 0.5 as inherently correct. Plotting precision and recall across thresholds makes the tradeoff visible; an F1-based balance is another selection criterion, not a substitute for deciding which errors matter most. section 4.6.5 section 4.7
Figure 4.11 Precision vs. Recall at Different Thresholds.
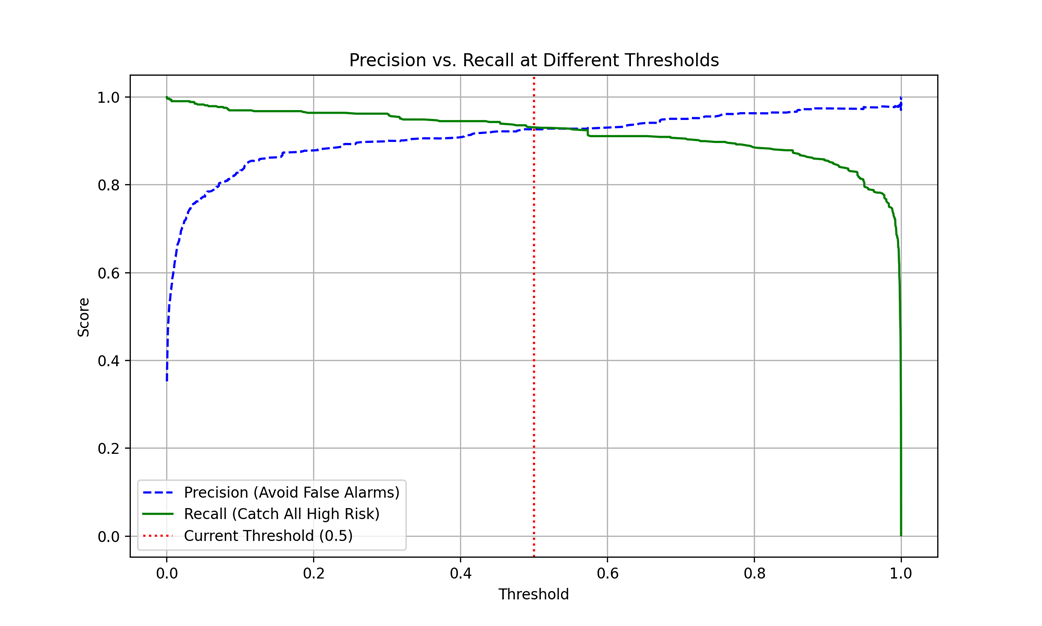
The plot compares precision and recall at different thresholds. section 4.6.5
Changing the cutoff and the inputs
A later demonstration uses a 0.3 threshold and shorter descriptions. It reports 0.01 for the low-risk example and 0.82 for the high-risk example, classifying both as intended. Because the inputs and threshold both changed, this comparison alone does not isolate the effect of lowering the cutoff. section 4.6.4