Linear regression predicts a number from labeled examples. Picture house prices plotted against number of rooms: the goal is to place a line as close to the points as possible, then use that line to estimate the price of a new house. section 3.0 section 2.7
A tiny housing model
Suppose nearby homes suggest a base price of $100 plus $50 for each room. The model is Price = 100 + 50 × rooms. For four rooms, it predicts $300. Here, rooms are the feature, price is the label, $50 is the weight, and $100 is the bias. section 3.2 section 3.18
With several features, the same idea assigns a weight to each one and adds a bias. A housing model can combine rooms, size, school quality, and age; geometrically, the fitted line becomes a plane or a higher-dimensional equivalent. section 3.6 section 3.37
A simple training process gradually improves the line:
- Start with random values for the slope and y-intercept. section 3.15
- Pick a random data point and adjust the parameters to improve its prediction. section 3.10
- Repeat for many epochs, using the square or absolute trick; the square trick is the more popular choice here. section 3.15
- Use the resulting weights and bias to predict a number for new feature values. section 3.18
Figure 3.6 An illustration of the linear regression algorithm. We start at the top left with a random line and end in the bottom left with a line that fits the dataset well. At each stage, two things happen: (1) we pick a random point, and (2) the point asks the line to move closer to it. After many iterations, the line will be in a good position. This figure has only three iterations for illustrative purposes, but in real life, many more iterations are needed.
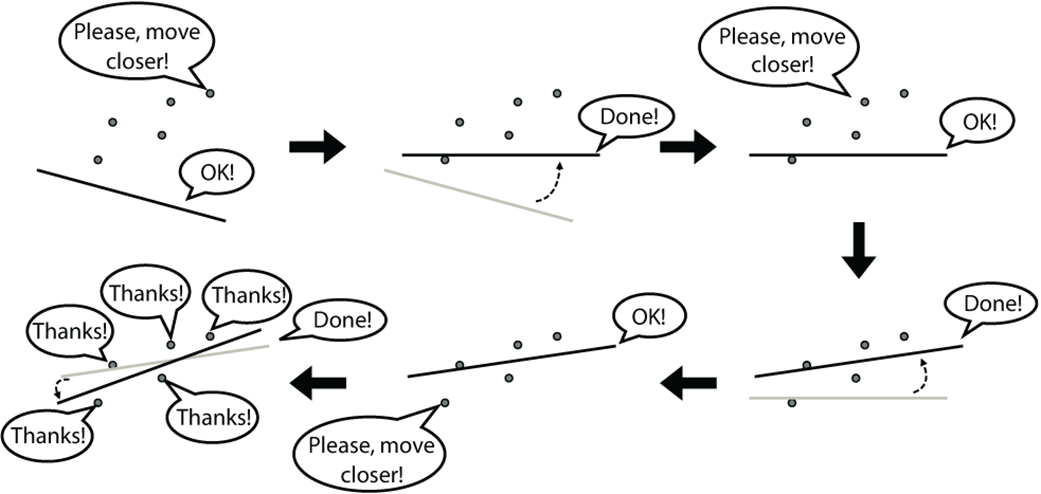
Follow the geometric view of training: a random line is repeatedly nudged toward sampled points until it fits the dataset well. section 3.9
For a larger real dataset, a linear regression model can be trained with scikit-learn. Housing-price data may need missing values removed, numerical features scaled and centered, and categorical features one-hot encoded before fitting a model with many features. section 3.27
Because its output is a quantity, linear regression can estimate stock prices, recovery time, customer spending, or how long someone may watch a video. It differs from classification, which predicts a category such as spam or ham rather than a number. section 2.8 section 2.7