A probability distribution describes how often values occur within a variable’s possible range, or how likely values are to appear within particular ranges. Distribution visualizations turn that pattern into charts such as histograms, pyramid charts, box plots, and violin plots. section 6.0
Build a distribution visualization by:
- Grouping data points into bins, usually equal-width ranges that collect values together. section 6.0 section 6.1
- Passing the relevant values to D3’s d3.bin() generator, which returns bins containing data points and boundary values. section 6.1
- Drawing a histogram to show frequency, or using box and violin plots to reveal medians, quartiles, averages, and distribution shape. section 6.0
Binning salary data
A salary dataset can be converted into bins with: const binGenerator = d3.bin().value(d => d.salary); const bins = binGenerator(data); Each resulting bin contains salary records, while x0 and x1 identify its lower and upper boundaries. The records can then drive a histogram. section 6.1
Figure 6.1 In this chapter, we’ll build four charts to visualize the salary distribution among data visualization practitioners based in the United States.
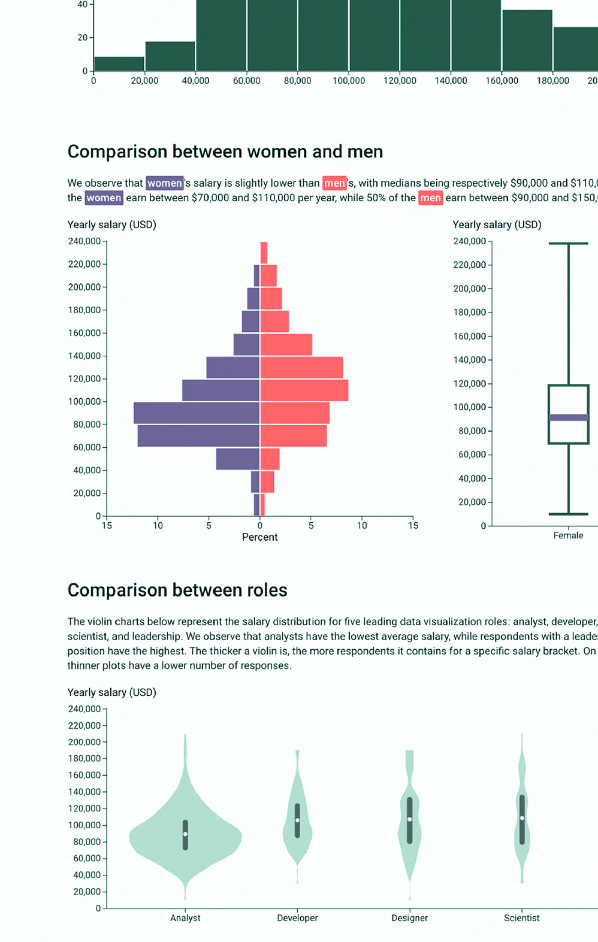
Compare four distribution views of salaries for US-based data visualization practitioners. section 6.0