A probability distribution describes how a variable’s values are arranged across its possible range and frequencies. Examining its shape reveals patterns that a single summary statistic can hide. section 4.1.3 section 4.4
Use distributions to guide analysis and communication:
- Plot histograms or boxplots to inspect shape, spread, extreme values, outliers, and possible data-quality problems. section 2.1.3
- Summarize the distribution with mean, median, mode, standard deviation, minimum, maximum, and counts, while recognizing that summaries can conceal skew or multiple modes. section 4.1.3 section 4.4
- Check whether a distribution satisfies the assumptions of a planned statistical test; transform data when appropriate, or select a test with fewer assumptions. section 4.4 section 5.1
- Report findings precisely to stakeholders, distinguishing observed group differences from claims about populations and stating interpretive limits. section 4.3.4 section 4.4
Figure 5.1 Each distribution is bimodal, which traditional measures of central tendency can’t detect.
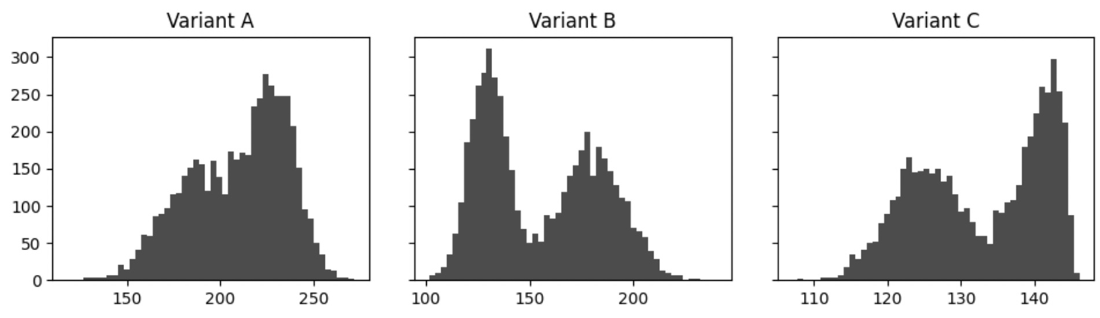
Use the bimodal-distribution figure to see why traditional central-tendency measures may miss important subgroups or structure. section 5.1
Comparing July weather
Generate distributions for Boston and New York City July 2022 weather, inspect assumptions, transform data if necessary, verify sample size with power analysis, and run an independent-samples t-test. Summarize which city appears warmer without overstating what the result proves. section 4.3.4