A probability distribution shows how likely each possible outcome is. In an LLM, it describes the likelihood assigned to every candidate token for the next step in a response. section 9.6.1
Use the distribution to understand how response settings change model behavior:
- Temperature changes the curve’s shape: higher values flatten it, making less-likely tokens more selectable and responses more creative; lower values make it more pronounced. section 9.6.1
- top_p limits selection to the most likely tokens whose cumulative probability reaches the chosen cutoff. section 9.6.1
A top_p cutoff
Suppose the next-token probabilities are “but” 0.6, “then” 0.2, “a” 0.1, “this” 0.06, and “that” 0.02. With top_p set to 0.8, the model keeps “but” and “then,” whose combined probability reaches 0.8, and discards the others. section 9.6.1
Figure 9.10 How temperature and top_p affect the creativity and predictability of an LLM’s output.
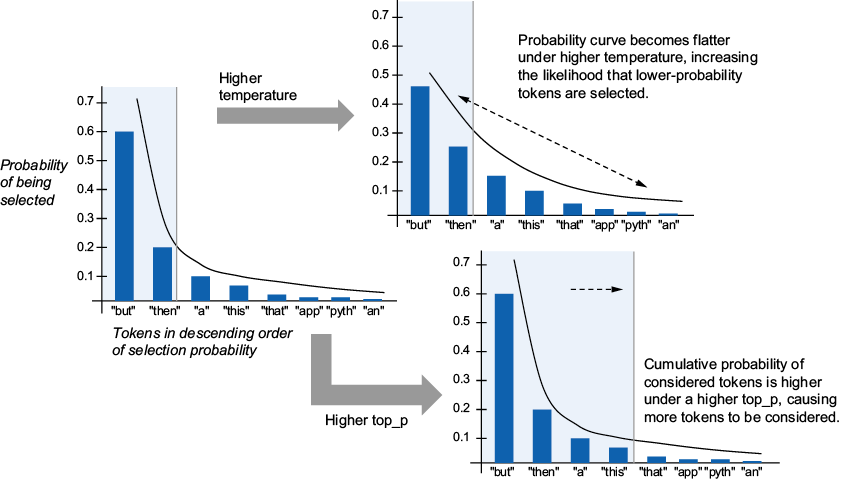
Compare how temperature and top_p affect an LLM’s creativity and predictability. section 9.6.1