Performance metrics quantify how well a process or system performs, making delays, queues, failures, and improvement results visible. Use them both to understand current conditions and to establish a standard for judging change. section 2.4.3 section 11.2
Apply performance metrics at two complementary levels:
- Map process steps with lead time (LT), touch time (TT), percent complete and accurate (%CA), and the work waiting between steps. A time ladder can total LT and TT across the process. section 2.4.3
- Monitor API infrastructure metrics such as CPU, memory, disk I/O, queues, network usage, and database connections. section 11.2
- Monitor service-level metrics such as latency, error rate, throughput, and uptime, then focus attention with the RED method or related SRE formulas. section 11.2
Setting a measurable improvement target
An API design review process has a total LT of 16 days. Its goal statement targets a 20% reduction, lowering total LT to 12.8 days within a defined period, such as a number of Agile sprints. Recheck the metric afterward to judge whether the improvement worked. section 2.5
Figure 2.7 Completed Current Conditions and Problem Statement section, showing the process map with metrics
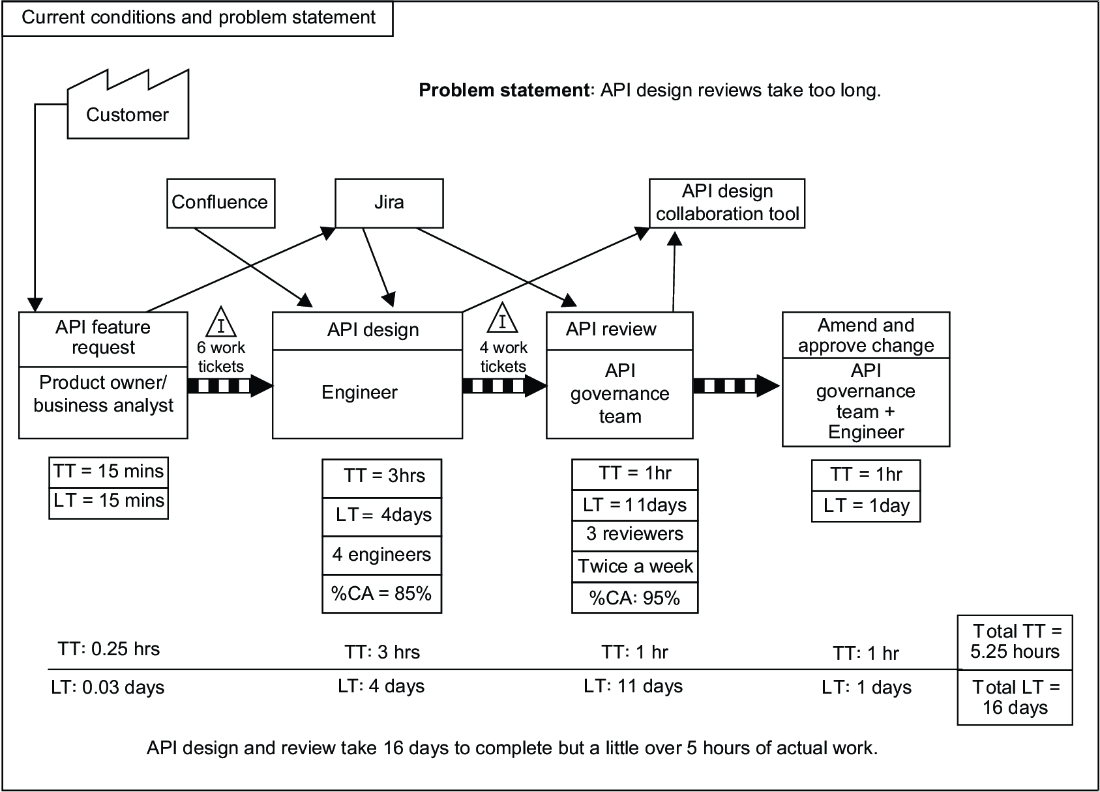
Use the completed process map to see metrics, queues, and time ladders placed directly on process steps. section 2.4.3
Figure 2.8 Example goal statement showing improvement target table
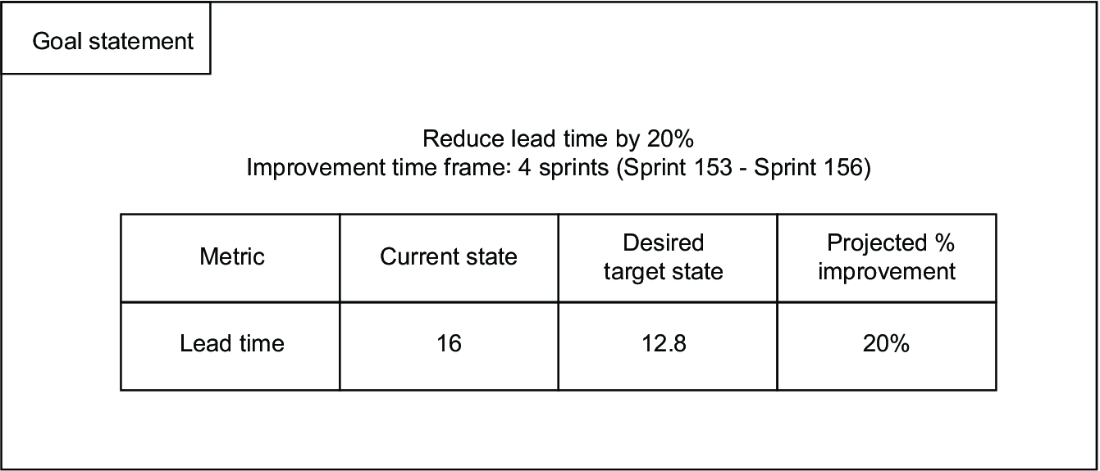
Use the goal-statement table to connect a baseline metric, a target value, and an achievement time frame. section 2.5