The normal distribution, also called the Gaussian distribution or bell curve, is a symmetric continuous distribution often used as a first assumption for continuous data. section 2.6.1
Use it as a practical starting point, not an automatic conclusion:
- Apply it to metrics such as sales figures, individual heights, and measurement errors. section 2.6.1
- Use the central limit theorem as rationale for approximate normality in sufficiently large sums of independent random variables with finite mean and variance. section 2.6.1
- Check the distribution before relying on statistical tests, because skewed data can undermine results that assume normality. section 2.6.1
A practical first question
Ask an AI assistant: “How can I test what distribution does my dataset fit best?” Add the analytical environment, data source, or an intuition to examine rather than simply confirm. section 2.6.1
Figure 2.2 Commonly encountered data distributions
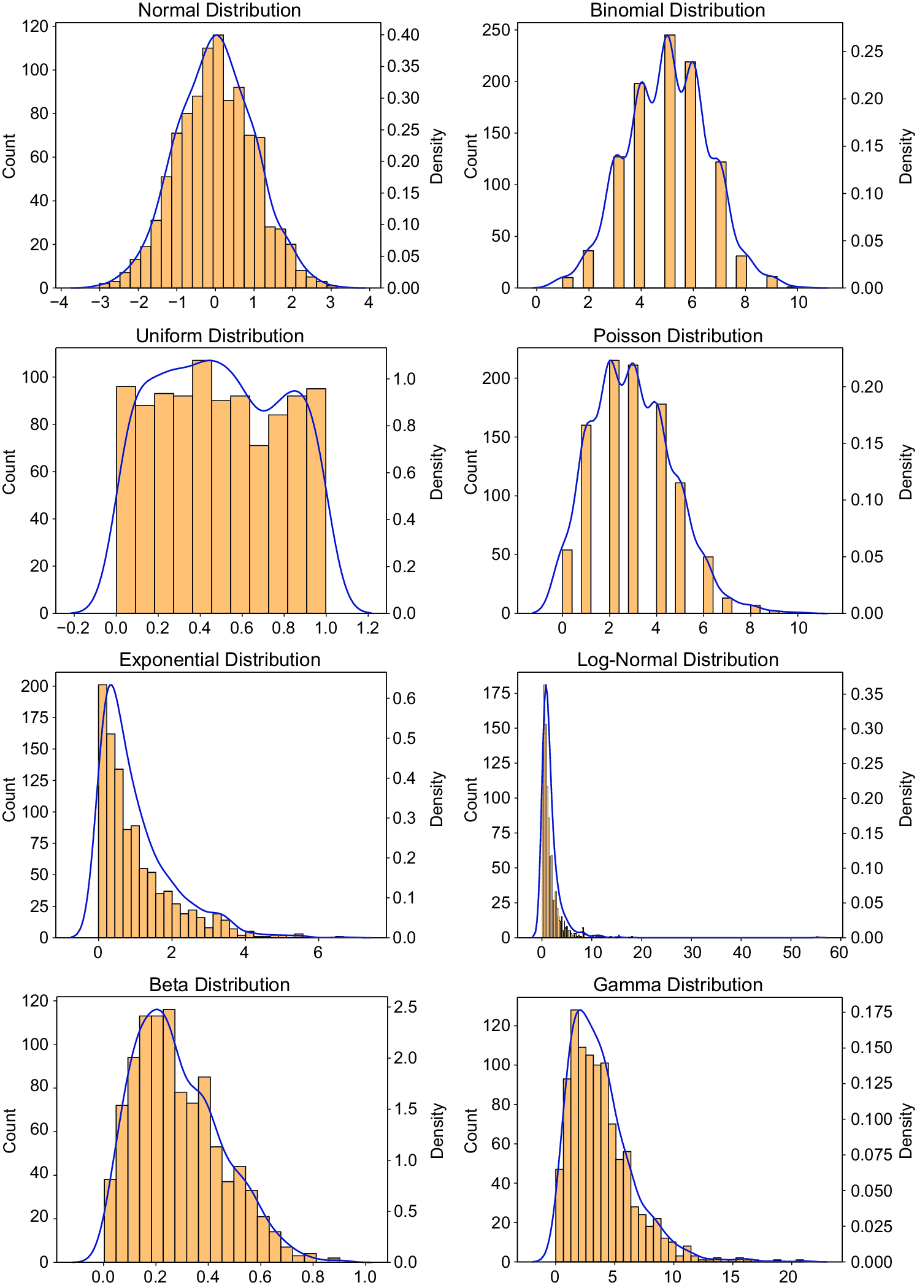
Compare the bell curve with other commonly encountered distribution shapes before selecting a model. section 2.6.1















