A normal or Gaussian distribution describes uncertainty in a continuous variable using a mean and a standard deviation. It can model aggregate variability arising from many small, independent sources, such as variation in production time. section 2.5
In production planning, probability distributions represent uncertainty that affects transitions between states. A normal distribution is useful for continuous quantities; a Poisson distribution instead models counts of discrete events, such as urgent orders. section 2.5
Figure 2.6 Two important probability distributions widely used for modeling business processes.
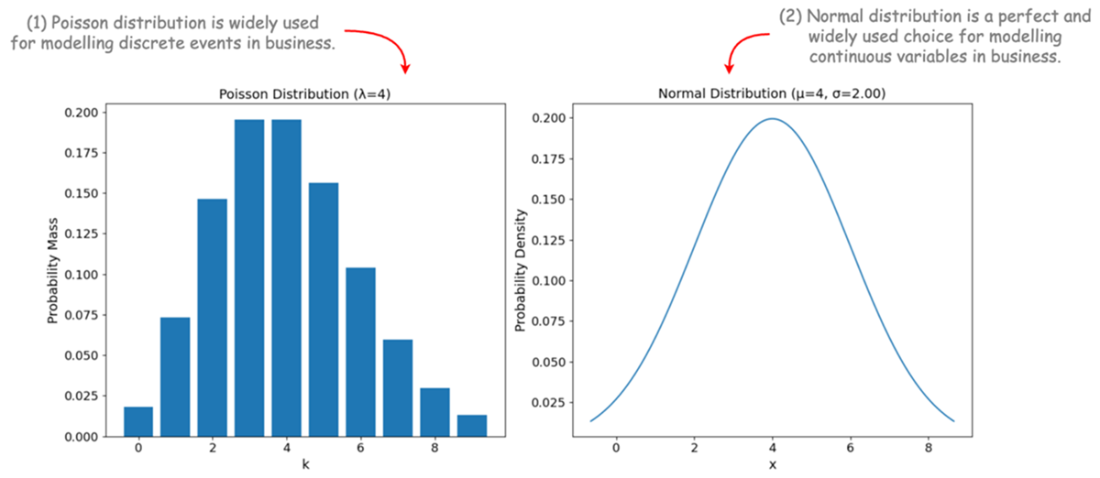
Compare the visual forms of the normal and Poisson distributions used to model business processes. section 2.5
A Gaussian distribution can also represent a policy over continuous actions. A neural network produces the mean and standard deviation for the current state, and the agent samples an action from that distribution. REINFORCE then adjusts the policy using the sampled action and its return-to-go. section 9.3
Sampling a fan speed
At a temperature of 25°C and rising, a policy outputs a mean fan speed of 0.7 and a standard deviation of 0.2, then samples 0.82. If the return-to-go is −50, the update pushes the policy to make 0.82 less likely in that state. A positive return would instead reinforce the sampled action. section 9.3