Performance is the quality of responding quickly and reliably enough that people can complete tasks with confidence. It is a product and business concern as well as an engineering concern: delays reduce trust, engagement, conversion, and retention, often without producing visible errors or direct complaints. section 1.2 section 2.0
Slowdowns commonly accumulate through small decisions that look acceptable in isolation: a heavy UI component, an inefficient query, an added API layer, or a dependency that loads too much. At production scale, a sluggish interaction or delayed response can make users leave, lower adoption, and consume engineering time through support and rework. section 2.0 section 2.1.4
Treat performance as an operational quality rather than a late optimization task:
- Define specific, user-centered goals for complete flows instead of asking to “make it faster.” Choose platform-appropriate measures, such as Core Web Vitals, response-time percentiles, startup time, frame rate, or input latency. section 3.6
- Use field data to find user-facing problems, lab data to debug and improve them, then field data again to confirm the result. section 3.6
- Translate regressions into money, time, and trust: identify affected users, estimate conversion, retention, or productivity effects, and make trade-offs visible to stakeholders. section 2.4 section 2.6
- Profile each change against performance budgets during development and review, then investigate and fix budget failures while the code is fresh. section 7.0
Speed as a conversion and adoption constraint
A faster landing-page variant can improve sales, leads, and cart visits; a one-second Largest Contentful Paint improvement correlated with lower bounce and higher conversions. For services, an API taking 800 ms rather than a competitor’s 200 ms can lose developer adoption before features or pricing are evaluated. The useful question is therefore not only how many milliseconds changed, but which high-value flow and audience bear the cost. section 2.1.4 section 2.2.3
Performance also affects discovery and organizational health. Mobile responsiveness, crashes, and battery drain can lower store visibility and ratings; inside teams, recurring regressions create firefighting, disengagement, and morale loss. Protecting speed requires shared ownership and making it part of the definition of done. section 2.2.2 section 2.3.2 section 3.6
Figure 7.1 The profiling loop during development. After writing or modifying code, the developer profiles the change against the performance budgets defined in chapter 6. If the result exceeds the budget, the developer investigates and fixes it while the code is still fresh, then profiles again. Code that meets its budget moves to review.
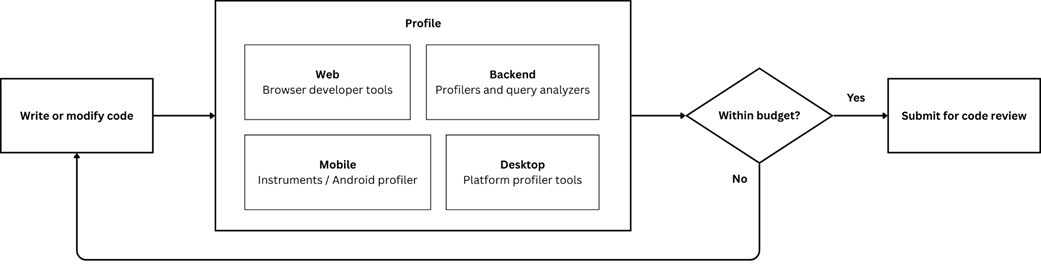
Use the loop to place profiling in normal development: profile a change against its budget, fix any overage, profile again, and send only compliant code to review. section 7.0