Web performance is the speed and responsiveness people experience while using a site, alongside the resources needed to deliver it. A fast interface feels reliable; a slow one can feel broken even when its features work. Heavy pages can be especially difficult on older devices, mobile networks, low-battery modes, and assistive technology. section 2.3.1 section 14.7.1
Choose architecture against the user’s task, not a preferred tool. If the first route requires seconds of JavaScript before someone can search, read, buy, or sign in, implementation cost has become a product problem. Vanilla Web can keep that cost low, but it is not automatically fast: effective design patterns and web-performance practices still matter. section 14.7.1 section 2.3.1 section 1.4
Measure the experience from several angles:
- Use Largest Contentful Paint (LCP) for loading speed, Interaction to Next Paint (INP) for responsiveness, and Cumulative Layout Shift (CLS) for visual stability. section 2.3.1
- Check when meaningful content appears, whether the first interaction responds promptly, and how much JavaScript must run before the page is useful. section 14.7.1
- Check whether repeat visits benefit from HTTP caching and service worker caching. section 14.7.1
Compare UI-update costs
A benchmark can create, update, and swap thousands of table rows to compare implementations. A vanilla DOM implementation avoids framework diffing and reconciliation costs in that operation. Treat this as evidence about raw UI-update speed, not a substitute for measuring loading, stability, and responsiveness in the actual application. section 2.3.1
Figure 2.6 With Core Web Vitals, we can quickly analyze the health of our web performance by checking just three metrics and where our values fit between good, needs improvement, or poor.
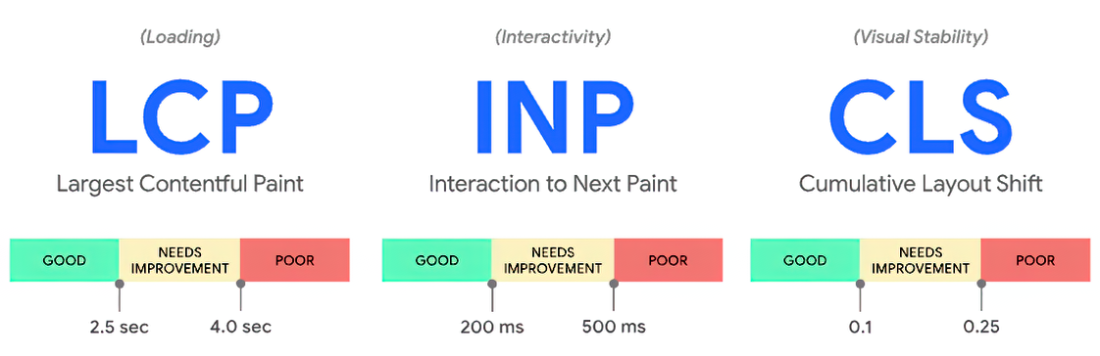
The Core Web Vitals figure shows how three measurements place web-performance health into good, needs improvement, or poor categories. section 2.3.1